
Why your money buys less every year — and how to fight back
Inflation is all over the news - it's up, and then it's finally 'within target'; but do we really understand it? I didn't, and although I think most people understand that high inflation is 'bad', I really don't think they know why or what's actually driving it…
You can tell because of our language. We point to a "Cost of living crisis!" and we say "Things are getting so expensive!" These phrases all point the blame at the thing, i.e. that thing you are buying is going up in price.
 Well, after listening to Raoul Pal (a highly respected thought-leader and communicator in the financial markets) for a bit, I realised I was wrong. It turns out that inflation isn't about things becoming more pricey; but rather, the buying power of my hard earned cash was simply less…a lot less. He calls this currency debasement. (See the comic from War & Peas!)
'Then' vs 'Now'
In the days of coinage, this showed up in a couple of ways - either shaving the edges of the coin so the actual amount of silver you got was less; or even more nefarious - mixing silver with other metals to reduce its purity. Both of these things achieved the same result, i.e. the silver coin - which got its value from the weight or amount of silver in it - was actually worth less.
In modern times, this happens slightly differently. Central banks increase the amount of dollars in the system via Quantitative Easing (QE). This means you have more money chasing the same amount of goods. Because demand outstrips supply, prices go up. The net result is that each dollar has less purchasing power. In short, you get less for the same amount.
Your hard earned dollars don't buy as much
In your lifetime, you would have seen the effects of inflation. Maybe it's a flashback to your childhood and memory of being able to buy your lunch at the school tuck shop for 50c …compared to today (yes, I am that old!).
Here is how that same inflation looks in graphs. I chose 2009 because that was when Bitcoin was launched, and that's significant.
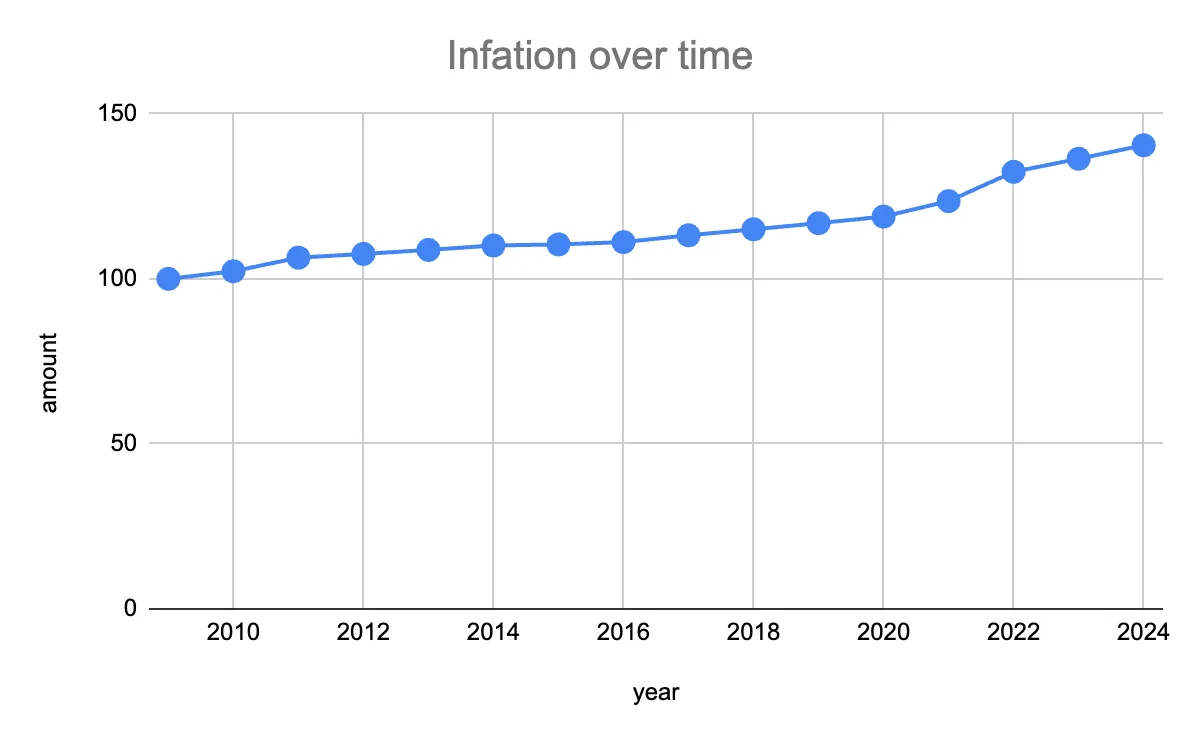 Fig 1. Inflation over time. Source: Stats NZ
Inflation is often charted upwards and to the right. This is a little disingenuous because this increase is not a 'good' thing for household budgets. What it is actually demonstrating is that what used to cost me $100 15 years ago now costs me $141 in today's money (i.e. 41% inflation).
A more powerful way of looking at this is to look at the adjusted buying power of your hard earned cash. Looking at what $100 will get you in NZ compared to 2009 isn't a fun experience, especially if you put 2 and 2 together and realise you have to work more hours to get that $41 dollars back (because your salary may not have been adjusted upwards at the same steep curve).
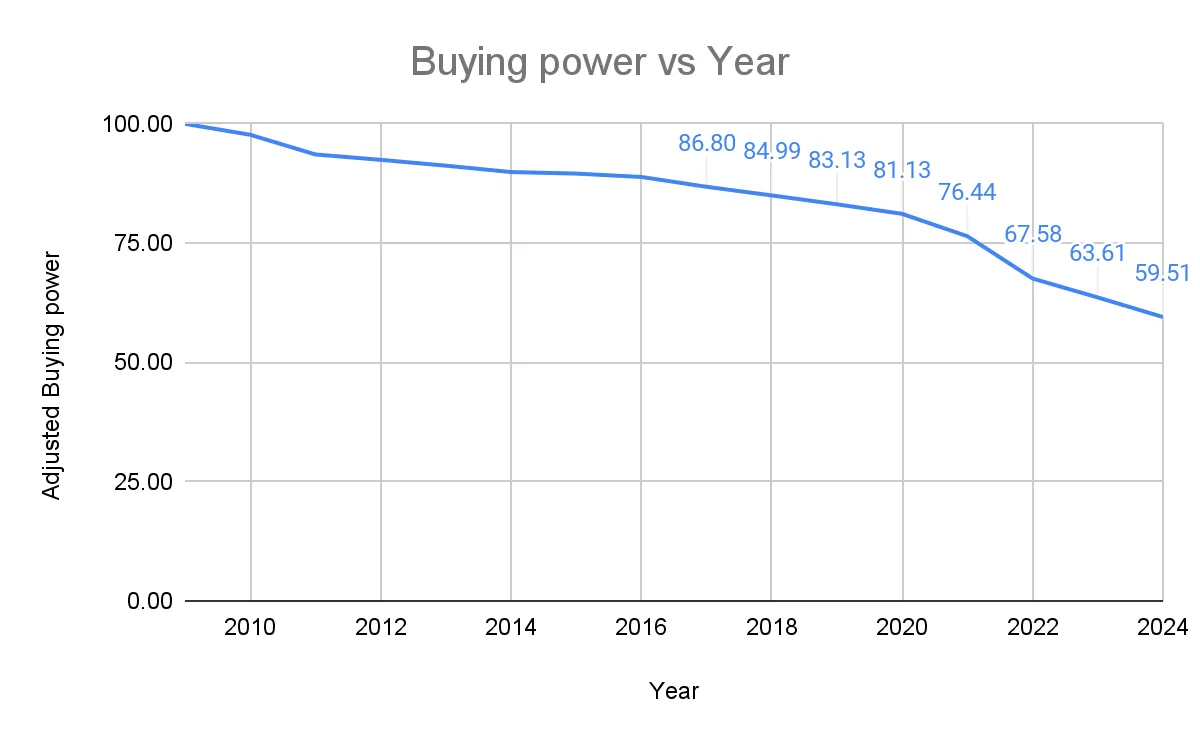
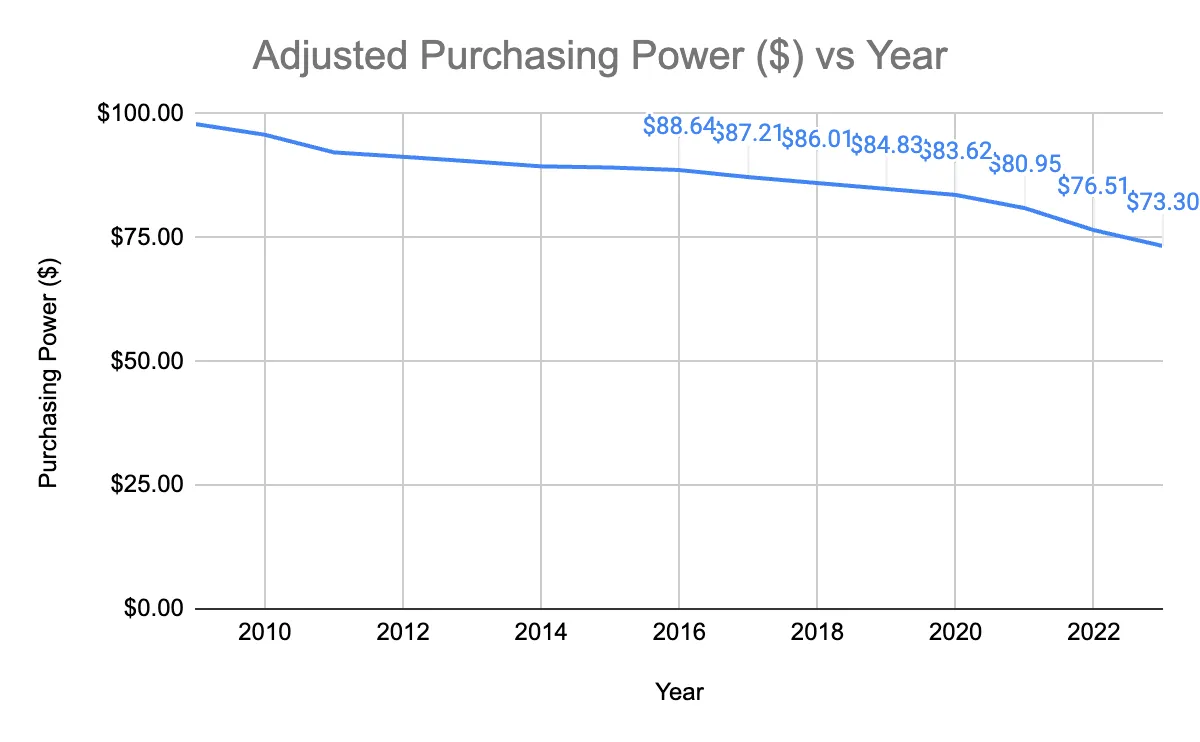
Fig 2. 'Buying power vs Year' and 'Adjusted Purchasing Power ($) vs Year'. Source: MacroTrends.net
Although most of us have had pay rises over that period, when we add in the labour cost index to our adjusted buying power, it still doesn't add up. In short, we're going backwards. It turns out that even with pay rises, the value of our cash is getting weaker. In fact, it's down $27 for every 100 you used to earn. If you are on minimum wage, you would have to work over an hour to earn the 'same' as you did in 2009 (adjusted for inflation).
How do we protect ourselves from currency debasement?
The most effective way of combating inflation is to buy things (assets) that are going up in value. However, you have to buy the right assets, and this is a lot harder than it sounds…
Because our hard earned cash's buying power is less, every asset looks like it's going up, but this is an illusion. It has to go up in 'real terms'. For example - if the thing you are buying was worth $100 in 2009, and is worth $141 now, it hasn't really gone up, it has simply kept up with currency debasement. For an asset price to go up in real terms, it means it has to be increasing by more than inflation.
Unfortunately, most economists talk to the general public using jargon and making sense of what is actually happening can be a challenge. Finance firms don't often use real returns either because bigger numbers mean more to investors (which is why it is crucial to do your own research on any asset).

Fig 3. A Google search for average returns on S&P 500. Always ask what the real returns are and as Consumer suggests, check the impact of fees. Source: Google.
The low-down on inflation-beating assets
Now that our eyes are wide open to what is happening to our cash and the need to start buying assets that are increasing in real terms, the next question is: what are they?
We've put together a non-exclusive list using data from Stats NZ, MacroTrends.net, TradivingView RBNZ, REINZ and ANZ Kiwisaver.
Explaining the facts
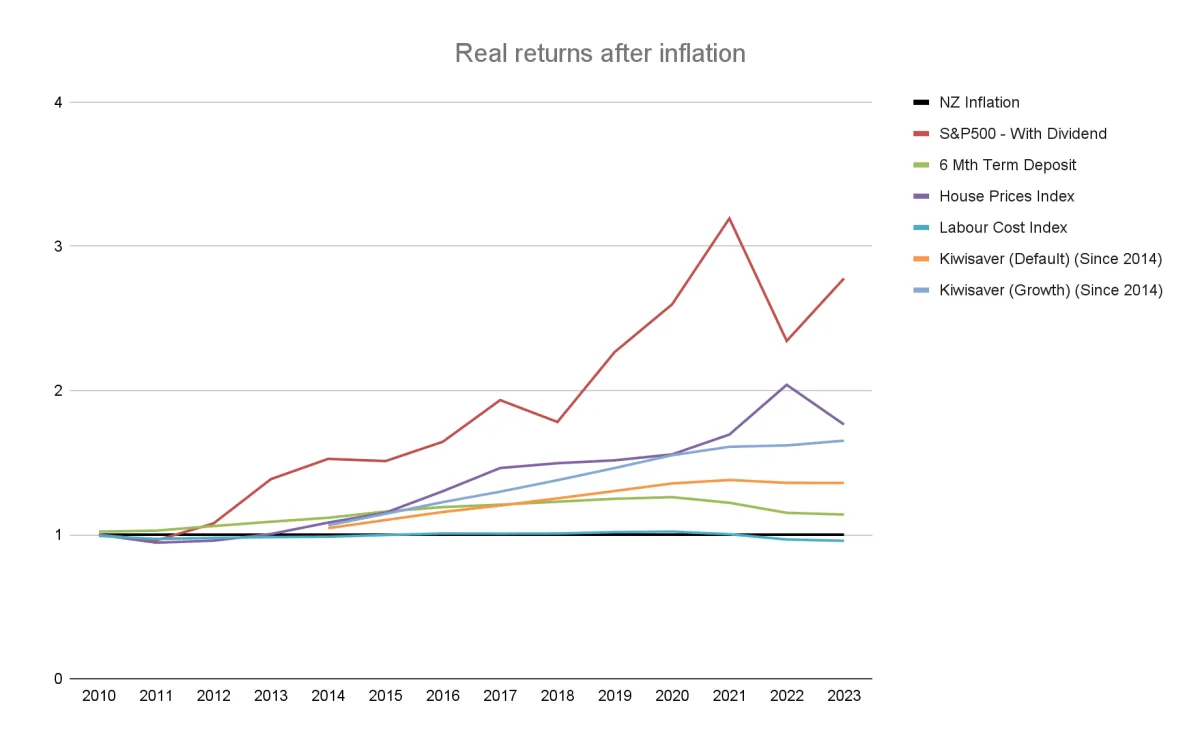
Fig 4. Real returns after inflation on a variety of assets (excluding Bitcoin). Source: Stats NZ, MacroTrends.net Tradingview, RBNZ, REINZ, ANZ Kiwisaver, Coingecko.
(Note: For completeness, the charts include the labour cost index, which reflects our pay rises. You can see this in the blue line below inflation. This is, quite frankly, worrying.)
Firstly, the S&P 500 index has beaten inflation most years.
Next up in New Zealand, house prices have also been beating inflation. They do this for a couple of reasons. The obvious one is that supply is lower than demand - we aren't building enough houses, and we keep importing people through immigration. The second reason is that property has some beneficial tax treatment that has historically made it a very attractive asset. Over time, this means a large portion of the older population's wealth is tied up in housing (a status quo that is very difficult to change and politically charged).
(Unfortunately, our recent research identified that many people feel like they can't get into the housing market anymore. The numbers are too big and it's just too tricky.)
We added in some other popular investments like a Default Kiwisaver and a Growth Kiwisaver. Thankfully, they also had positive real returns.
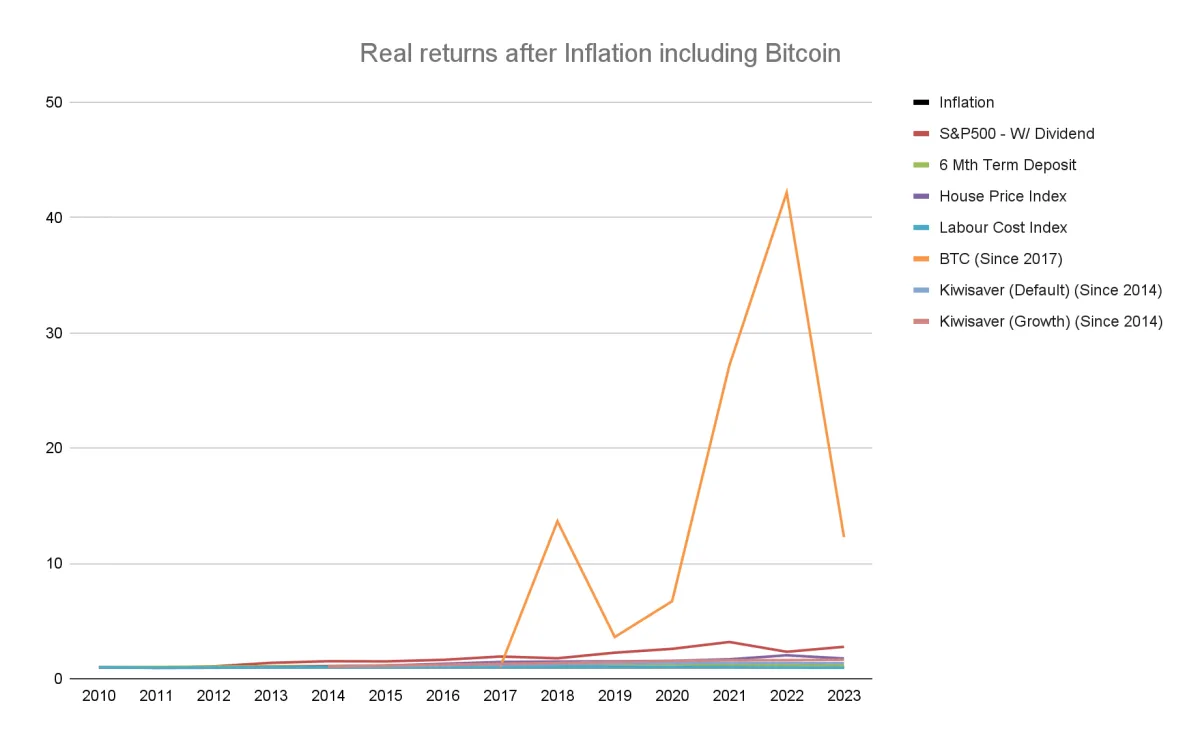
Fig 5. Real returns after inflation on a variety of assets (including Bitcoin). Source: Stats NZ, MacroTrends.net Tradingview, RBNZ, REINZ, ANZ Kiwisaver, Coingecko.
Finally, we also added in Bitcoin. We only ran it from 2017 because the numbers are so staggering, it makes the chart meaningless if we add it from 2009. As you can see, it blows every other asset out of the water, even when it has 'bad' years.
Why has it performed so well? Bitcoin has a programmatic supply curve which means the software is written so there is only ever going to be 21 million Bitcoin (they get released into the world every time a block is mined which is about every 10 minutes). Every four years, the software halves how many Bitcoins are released, meaning there is less supply. Less supply and growing demand has seen prices go up. How up? Take a look at Bitcoin's price rise in real terms (after inflation) above.
Significantly, we aren't the only ones that have done this comparison. Charlie Bilello, a researcher for Creative Planning, puts out this chart every month. (Note: These returns are before inflation, and a quick rule of thumb is to take off 2% to get the real returns.)
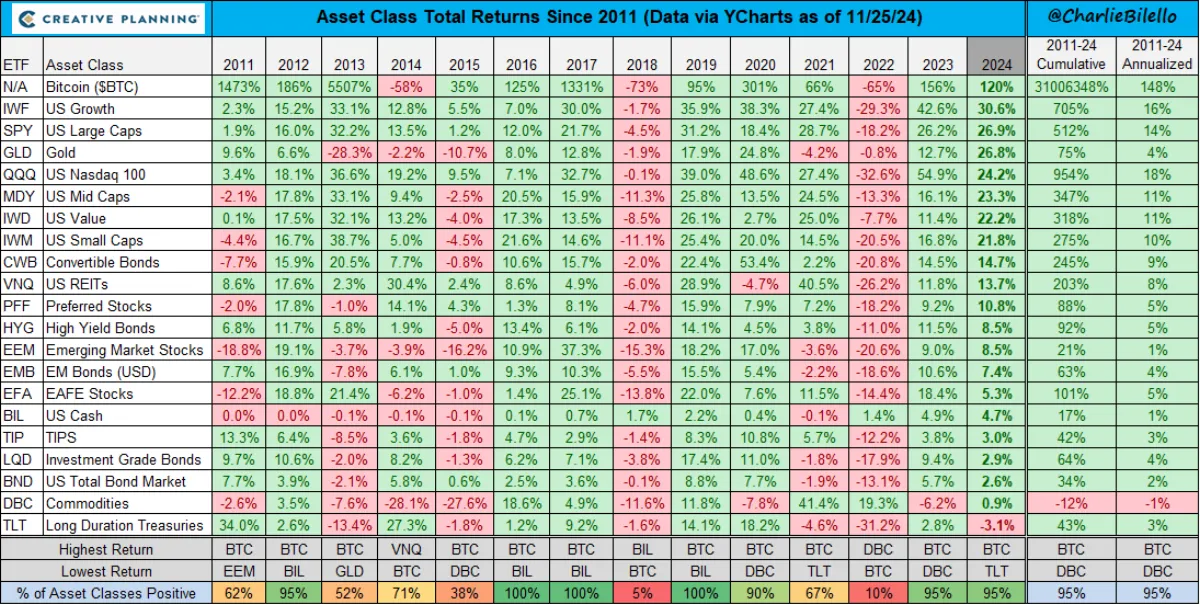
Fig 6. Returns before inflation on a variety of assets (including Bitcoin). Source: https://bilello.blog/2024/the-week-in-charts-11-26-24.
You got me, this Bitcoin thing might have legs!
Welcome to the party.
First things first - Bitcoin isn't like any other asset because it's just software. It's not owned or controlled by any one company or country. It works on the internet, and it never stops, operating 24/7.
Ok, but aren't I already too late? Well, it's true that Bitcoin has grown in value (a lot), but that doesn't mean it is finished. There are a lot of people in the world who don't own Bitcoin yet, and that means there is still a chance that supply and demand could work in your favour.
Here is how that might play out:
- What we know is that there are 9 billion people on the planet and only 400 million wallets with Bitcoin.
- We also know Bitcoin has a fixed supply of 21 million, and as of today, about 19.8m Bitcoin have been mined.
- We also know that some of the biggest financial companies in the world are starting to get into Bitcoin now.
I'll let you draw your own conclusions.
"But isn't it expensive?" I hear you ask. To buy a whole Bitcoin is expensive - however, you can buy a small fraction of a Bitcoin. So, while the price of a Bitcoin might be out of your reach, you can still own a small piece of one. And even owning a small amount can have big impacts…
Here's an example. Let's say you first got into Bitcoin in January 2018. You had heard about the first big Bitcoin rally and decided to spend $50 per month on purchasing Bitcoin through EasyCrypto (a strategy called 'Dollar cost averaging' in which you make regular purchases regardless of price).
You would have put in $4250 of your cash over that period, but that would now be worth $31 122. (Work it out for yourself here.) The key here is time. Raoul Pal said it best: "Hang onto Bitcoin long enough and it forgives all bad entry prices."
This is economist speak for: if you hang on long enough, it doesn't matter what price you buy at.
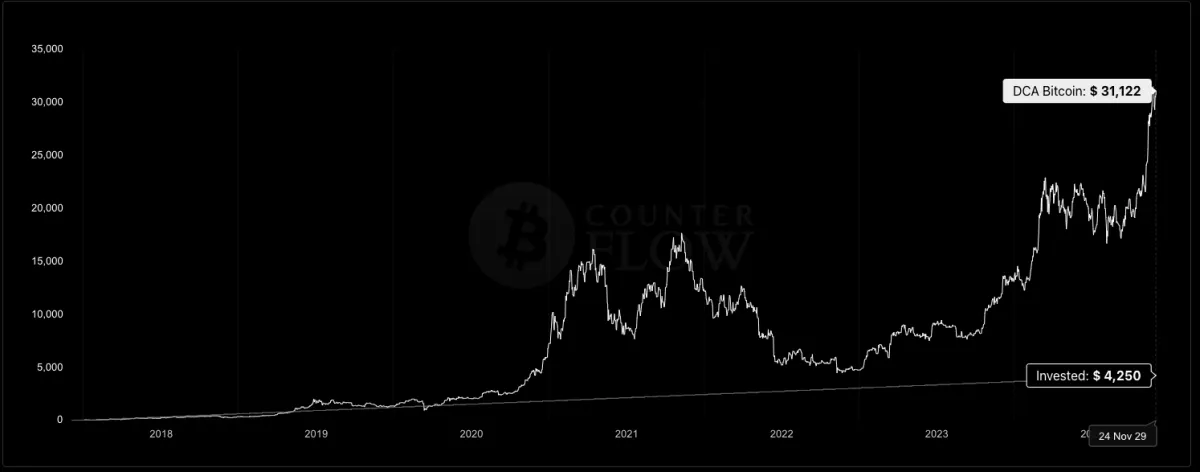
Fig 7. The price of Bitcoin over time. Source: https://bitcoincounterflow.com/dca-calculator/
The key takeaway from all of this is that inflation isn't just about things getting more expensive - it's about your money losing its buying power.
Understanding this shift in perspective allows you to take action and protect yourself financially.
Once you see inflation for what it is, you can start making decisions that preserve and grow your financial power in real terms by investing in inflation-beating assets so that you're better equipped to handle its effects, no matter how complex the system gets.
(Investing involves risk, and digital assets are volatile. Returns aren't guaranteed, and past performance doesn't indicate future returns. Please do your own research.)

